Reporting Overview
- Emergency Management
- Campus360
- Connect360
- PBIS Rewards
- Hall Pass
- Preparation & Response Training
- Behavioral Case Manager
- Visitor Management
-
Compass Curriculum
Training Workshops Getting Started On-Demand Release Notes & Updates Data & User Management Compass Curriculum for Students, Staff, & Families Compass Behavior Intervention Compass Mental Health + Prevention Compass for Florida - Character Ed, Resiliency, & Prevention Compass for Texas - Character Ed Analytics & Reporting Additional Resources
- School Check In
- ALICE Training Institute
- Digital Threat Detection
- Anonymous Tip Reporting
- Resources
- Back-to-School
Learn how to use the various reports in Compass Curriculum to gain comprehensive insights into your organization's performance.
Compass Curriculum Reporting
Monitoring student progress is easy with Compass Curriculum. This document outlines the most common ways to use the reporting features in Compass. Custom reporting may also be available upon request.
The groups and students available to view will depend on your user permissions. Admin Users will have the ability to view to grades, all classes, and all students, while teachers will be able to view any of their shared rostered classes or individual students on their rosters.
Reporting Overview
Report Name |
Who Can Access |
Purpose |
Where to Find |
| Student Profile | Teacher, school, or district admin user | Acts as a “report card” to monitor student progress through lessons throughout the school year. | Select ‘Users’ on the admin home page, then select ‘Student’. |
| Group Assignments Report | Teacher, school, or district admin user | Easily view a group's progress on a particular assignment. | Select ‘Assignments’ on the admin home page, then select ‘Group Assignments’. |
| Summary Report | Teacher, school, or district admin user | Get a quick snapshot of how a selected group is performing. | Select ‘Reporting’ on the admin home page, then select ‘Summary’ |
| Teacher Report | School or district admin user | Monitor and analyze teacher engagement and lesson completion rates by classes associated to each teacher. | Select ‘Reporting’ on the admin home page, then select ‘Teacher Report’ |
| SEL Assessments Report (SECA) | Teacher, school, or district admin user | View and compare SECA data for beginning, middle, and end of year SEL Assessments. | Select ‘Reporting’ on the admin home page, then select ‘SEL Assessments’ |
| SSIS + MH Reports | Teacher, school, or district admin user | A reporting suite to aid administrators to see current student SEL + MH status and progress over time. | Select ‘Reporting’ on the admin home page, then select ‘SSIS Assessment Reports’ |
Student Profile
Regardless of your role (teacher, school admin user, or district admin user), you have access to the Student Profile for each student assigned to you. The Compass Student Profile outlines all assigned lessons and status for each lesson. This is a useful tool to verify whether students have completed all assigned lessons, or check for understanding on each lesson. The Student Profile can be accessed from the main admin home page. From here, students are listed in alphabetical order by first name, or you can search for a specific student using the search function.
To access the Student Profile from the home admin page:
Click ‘Users’ then 'Students' on the menu on the left side.

All assigned students are listed in alphabetical order by first name. You can also search for a student by entering their name in the search field.

Click on the three-dots in the ‘Actions’ column on the far right, then select ‘Go to Profile’.

You will then be taken to the Student Profile.
Understanding the Student Profile
The Student Profile begins with demographic information about the student:

The Student Profile is further divided into (up to) four sections, based on the Compass and/or PBIS Rewards solutions at your school.
Click to expand each section below to learn more.
Lessons
This section contains the following information about students' progress:
- Lesson Name - Title of the lesson assigned
- Date Assigned - The date the lesson was assigned to the student.
- Due Date - The deadline by which the student is expected to complete the lesson.
- Pre Score - The student's score on the lesson's pre-test.
- Post Score - The student's score on the lesson's post-test.
- % Improved - The percentage improvement between the pre-test and post-test scores.
- Completion Date - The date and time the student completed the lesson.

🚩NOTE:
- If the student has not started a lesson, no data will appear next to the lesson.
- If a student has started a lesson, data will appear in the "Pre Score" column, indicating their pre-test score.
- If a student has completed the lesson, additional data will be available, including the post-test score, improvement percentage, and completion date.
- If the ‘Repeat on Fail’ toggle is disabled at the administrative level, or if the pass/fail threshold is set to zero, the ‘Pass’ column will display a dash ('-') instead of ‘Yes’ or ‘No’, indicating that field is not applicable.

Additional Information
Clicking the lesson title link allows you to see all lesson questions, student's answers, and open-ended reflections (if applicable) for lessons.

The Pre Score and Post Score columns contain links to view detailed test results.

Assessments
🚩To view information on this section, the Beginning of Year, Mid Year, or End of Year SEL Assessment (SECA) must be assigned and completed.
The 'Assessments' section displays students' SECA SEL Assessment information, including their CASEL competency scores, subdomain scores, and survey responses. 
Participation
The 'Participation' section tracks student engagement with the platform. It can provides insights into how frequently a student is using the system and engaging with assigned materials.
- First Login – The date the student first accessed the platform.
- Last Login – The most recent date the student accessed the platform.
- Number of Daily Logins – The number of times the student logged in.
- Number of Questions Answered – The total number of questions the student has answered.

PBIS-R Referrals
🚩To view information on this section, your school/district must have an active subscription to PBIS Rewards, PBIS Rewards Behavior Referral System, and Compass Behavior Intervention.
The SIS data for the school/district must also be synced through Clever or ClassLink for all solutions.
The ‘PBIS-R Referrals’ section of the Student Profile displays information for referrals created for students in PBIS Rewards Behavior Referral System that included the assignment of a Compass Behavior Intervention lesson.
🚩NOTE: If your Student Profile also displays a ‘Diagnostic Report’ section, it will be removed at the end of the 24/25 school year during the archival period.
Assignment Reporting
If you have assigned a lesson to a group of students, either a classroom or grade level, you can easily see how they performed by selecting the ‘Assignments’ tab in the left-hand menu. From here, select ‘Group Assignments’ to access reporting. This option allows teachers, school, and district admin users to track student lesson completion as a group in one spot.
To access the Group Assignments Report from the home admin page:
Click on ‘Assignments’ in the left-hand menu. Select ‘Group Assignments’ to view the list of assigned lessons.

The report displays a list of assigned lessons for a specific group, including the following details:
- Lesson title
- Who assigned the lesson
- Type - Indicating whether a lessons was assigned to a class or grade level.
- Audience - The target students for the lesson, for example, the first grade or Mr. Henderson's homeroom.
- School - The school associated with the assignment, if applicable.
- Start and End Dates for lesson completion
- Completion Percentage - Indicates how many students in the assigned group have completed the assignment
- The 'Active' column allows you to filter by currently active and inactive assignments
-
Click the three-dot menu in the ‘Actions’ column on any assignment to:
- ‘View Lessons’ to see the individual students assigned to each lesson.
- ‘View Quiz Answers’ to see individual student responses for each quiz question.
- ‘Edit’ allows you to edit the lesson details.
- ‘Merge Duplicates’
- ‘Delete’

🚩NOTE: Lessons that are manually marked completed will display ‘Not Taken’ in the ‘Scores’ column but ‘Yes’ under the ‘Complete’ column.

Summary Reports
The Summary Report provides a high-level overview of student engagement, usage, and assignment completion. This report helps school or district admin users and teachers track participation and identify trends within their schools or districts.
To access the Summary Report from the home admin page:
Navigate to ‘Reporting’ in the left-hand menu. Click on ‘Summary’ to access the report dashboard.

From this screen;
- You have the option to view data by district or school, if you are a district admin user.
- You will see the data for your assigned building if you are a school admin user.
- You will see the data for students in your shared classes if you are a teacher.
The Summary Report is further divided into (up to) five sections, based on the Compass solutions at your school.
Click to expand each section below to learn more.
Students
The ‘Students’ overview provides a visual breakdown of student lesson distribution by grade level. This bar chart displays total users and registered users across all grade levels. This allows you to compare the total number of users rostered with the number of users that have logged in at least once as well as identify grade levels with the highest or lowest levels of student usage and engagement.

🚩NOTE: If your school or district has also purchased Compass Curriculum for Families, you'll see a ‘Parents’ overview, as well.
Logins
The ‘Logins’ section tracks students’ login frequency across all grades. The chart provides a detailed view of student access to the Compass lessons over time.
With this report, you can:
- Monitor login trends over different time frames.
- Identify grade levels where students are logging in frequently.
- Assess student engagement and adjust strategies accordingly

Assignments
The ‘Assignments’ section provides detailed statistics on student lesson completion, including:
- Total Assignments – The number of lessons assigned to students.
- Assignments Completed – The number of lessons successfully finished by students.
- Completion Rate – The percentage of completed lessons versus total lessons assigned.
🚩NOTE: This data can be filtered by month, grade, or class.

Lessons
For a more granular view, users can scroll down to the ‘Lessons’ section and do a deeper dive into individual lesson completion rates. Each lesson displays the total assigned count and the number of students who have completed it. The percentage completion rate is easy to see as it is visually represented with a circular progress indicator.

This section is used for tracking lesson progress and identifying areas where additional student support may be needed.
To see a list of students that have or have not completed their lesson assignments, simply click on the number under the list you want to see.
For example, if I wanted to see all of my students' progress on the "Accidents Happen” lesson, select the number underneath the "Total Assigned" heading. From here, you’ll see a list of students who have been assigned the lesson and their status.

🚩NOTE:
- The ‘Scores’ column will show the scores from the most recent attempt. If the student hasn't started the lesson, it will indicate as ‘Not Taken’.
- The ‘Complete’ column will show whether or not each lesson is complete.
- To see a list of students who completed the lesson, select the link underneath ‘Total Complete’.

Teacher Report
The Compass Teacher Report provides Admin users with detailed insights into teacher engagement and lesson completion across schools and/or district. This report enables administrators to assess instructional fidelity and identify areas requiring support.
To access the Teacher Report from the home admin page:
Navigate to the ‘Reporting’ section in the left-hand menu. Select ‘Teacher Report’ from the dropdown options.

The report displays all teachers in alphabetical order by first name. You can narrow down by typing a teacher’s name or school into the search box. School Admins will only have access to data for their assigned school(s).

Select a teacher’s name to open their Class Lesson Report, where you can view both lessons that have been assigned and those that have been completed.

To explore data at the student level, click Students. This section highlights which students have lessons assigned and which have finished them. You can also find a specific student by entering their name in the search box. Click on any student’s name to see a full list of their assigned lessons and related details.

Compass Assessments
There are three different types of assessments available in Compass. Click on each tab below to learn more.
Formative Assessments
Formative assessments found in each lesson as pre and post tests, which provides immediate corrective feedback to students. Reporting on these is discussed in the Student Report above. These results can be used to provide ongoing feedback that helps both teachers and students focus on areas that need improvement. With this data, teachers can identify gaps in understanding and adjust instruction accordingly or differentiating instruction based on student needs.
SECA
The Washoe County School District Social and Emotional Competency Assessment (SECA) is a complimentary open-source assessment build into the Compass Curriculum scope and sequence that measures the self-reported social and emotional competencies of students in grades 5-12. The SECA was developed in a collaboration among WCSD, the Collaborative for Academic and Social and Emotional Learning (CASEL), and the University of Illinois at Chicago through an Institute of Education Sciences grant. It is recommended that students complete the SECA three times a year – at the beginning of the year, middle of the year, and end of the year.
For information on SECA reporting, please see ‘SEL Assessment Reports’ below.
SSIS
For an additional cost, Compass Curriculum also offers the SSIS SEL + Mental Health student self-assessment for grades PK-12. This norm-referenced and validated universal screener is a powerful assessment for gathering insights on the five SEL competencies and on students’ emotional behavior health.
The SSIS is also available as a multi-informant option to help give a more holistic view of the student from their teacher and their parent/guardian. You can use the results to assign additional lessons to students in areas of need or provide interventions for students who express emotional behavior concerns (both internalizing and externalizing).
It is recommended that students complete the SSIS at least twice a year, but ideally three time a year – at the beginning of the year, middle of the year, and end of the year
For more information on SSIS reporting, please see ‘SSIS SEL+MH Reports’ below.
SEL Assessment Reports
If your students have completed the SECA, you can see the results in the SEL Assessments report.
To access the SEL Assessments report from the home admin page:
Click ‘Reporting’ then 'SEL Assessments' on the menu on the left side.

The assessment report shows the scores for each assessment the student has completed (beginning, middle, and end of year assessments). The top shows which assessments have been completed and the date each one was completed. By clicking on each of these, you can include or remove the data from that assessment. Once multiple assessments have been completed and selected, you'll be able to see the changed scores for each assessment.
The scores are broken out into three sections:
I - CASEL Competency Scores
This section indicates students’ scores for each CASEL competency.
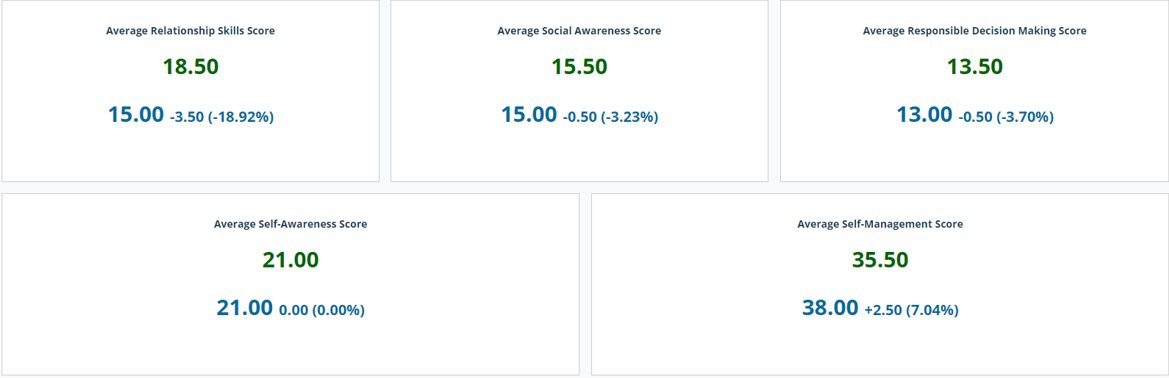
To interpret the results, each report also includes a Scoring Rubric, specific for the students’ grade band (K-2, 3-5, 6-8, 9-12).

Averages scored within the ‘Mastering' category, indicate the student is excelling in that domain. Students may need little to no support in these areas. It is recommended to continue current instruction.
Averages falling within the ‘Developing’ or ‘Struggling’ category indicate that the student may need additional support in that domain. To support the student, teachers can assign additional Compass lessons to support these specific areas by searching for lessons falling under the SEL domain of concern.
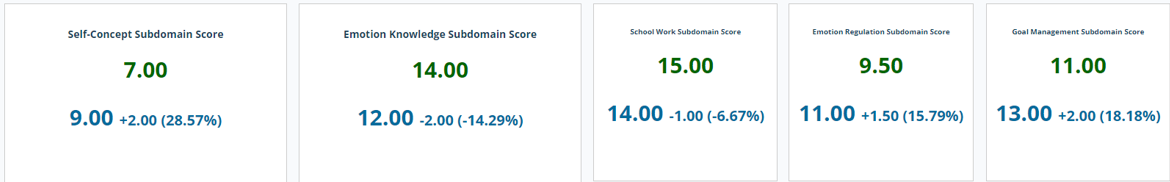
II - Subdomain Scores
Two competencies, self-awareness and self-management, are broken up into four specific subdomains that address a specific skill set. This data can also be used to inform instruction for students.
III - Survey Responses
It can be impactful to see how an individual student answered particular questions on the assessments. These answers will be in the survey responses summary and broken out by each survey as tabs in the report. Use this information to provide targeted interventions for students as needed.

For more information on using the SEL Assessments report, please see this article.
SSIS SEL+MH Reports
🚩To access this report, your school/district must also purchase access to the SSIS screener.
The SSIS SEL + MH assessment provides information about students’ strengths and areas for improvement that help guide instruction planning and interventions. The robust SSIS reporting suite is used for school and district administrators to see current status and progress over time. The most central report is the SSIS Student Detail report that highlights current and longitudinal data for each student.

The SSIS SEL + MH assessment provides an in-depth view of the student that can be used by teachers to identify and implement instructional practices to support students. The report highlights current and longitudinal data and trends. The report can be shared with parents or guardians, and the data can be integrated into existing systems to create a robust whole-child analysis.


For more information on accessing and using the SSIS Assessment Reports, please see this article.
Additional Reports
In addition to the summary and student usage reports that are available for all programs, some of our modules include specific reporting that helps to identify trends and drive compliance for statewide mandates. Please see each article for how to read and interpret each of these reports.
- Intervention - Please see this article about using the Intervention Report
- Resiliency - Please see this article about using the Resiliency Ed Progress Report